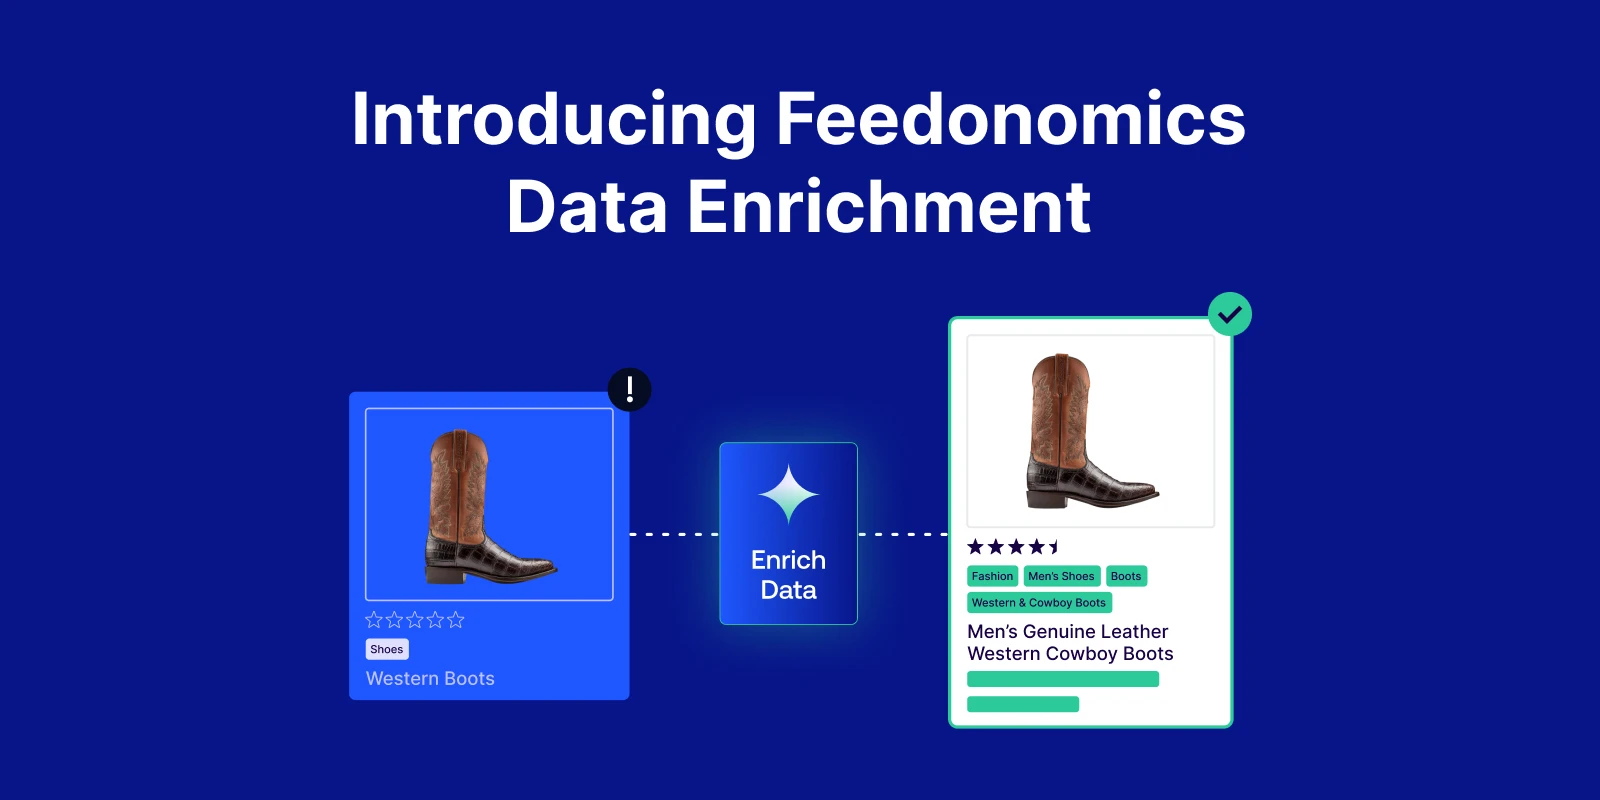
When it comes to ecommerce, managing and analyzing your data is one of the best ways to improve performance. Fortunately, there’s a new feature in the Google Merchant Center that provides additional insight into how your products are performing.

Merchants can now create custom reports and dashboards to view how their products performed across different Google programs, including Shopping Ads, Shopping Actions (Buy on Google), and Surfaces across Google.

Create Report

To access the reports feature, log in to the Merchant Center and click on “Performance” in the left sidebar menu. You should see “Your reports” underneath.

Google Merchant Center Dashboard

You can customize the rows and columns of your report to display the performance metrics you’re interested in, and see how they correspond to various product attributes like brand, product type, or custom labels. Your order metrics for Shopping Actions, either for the entire product assortment, or on the item level for certain metrics are also available.

To get started, click “Create Report” and then drag and drop various options from the side panel into rows or columns. The options are grouped under dropdown menus that include “Performance,” “Order metrics,” “Item metrics,” “Product attributes,” “Date,” and “Other.”

Google Merchant Center Create Custom Report Dashboard

In the “Performance” dropdown, you can choose whether to show your clicks, CTR, and impressions in the report. The reporting is not as detailed or robust as you would get in Google Analytics, but you can still get a good sense of your general performance this way.

The “Order metrics” dropdown menu includes display options for your total orders, shipped orders, unshipped orders, average order size, average order volume, and more. This data applies to products in the Shopping Actions program. You can’t cross-reference these high-level order metrics with any specific product attributes (like product type, brand, or product ID), so they essentially provide a daily snapshot of your orders when you break them down by date.

If you select “Item metrics,” you can add options like “Ordered items,” “Returned items,” “Shipped item sales,” and many more. These data points can be cross-referenced with the product attributes to give you a more granular sense of your performance. For example, you can see which product types or brands are selling, or you can break down your orders by product ID. There are many other options to choose from, including custom labels.

Google Merchant Center custom report product types

From the “Product attributes” dropdown menu, you’re able to add item-level attributes like brand, product type, Google product category, product ID, custom labels, titles, and more to your report. You can even choose which tier of product type or category to show, so if you have a product taxonomy like “accessories > belts > leather belts” you can choose to see the first tier (accessories), the second tier (belts), the third tier (leather belts), or a combination of the tiers.

The “Date” dropdown option allows you to see the performance metrics broken down over time. You can adjust the date range at the top right corner of your report to decide how far back you’d like to look.

The “Other” dropdown option lets users add a “Program” column or row to the report. If your products are enabled for Shopping Ads, Surfaces across Google, and Shopping Actions, you can see their performance broken down for each program. This makes sense to use in conjunction with the clicks, CTR, and impressions options from the “Performance” metrics.

Introducing Google Merchant Center Custom Reports and Dashboards

The default display is a table or spreadsheet, but you can also choose to display your data as a line chart, bar chart, stacked bar chart, or pie chart.

Google Merchant Center custom report view types

Once you’ve created your report, don’t forget to save your work! It will not autosave.

Create Dashboard

You can access the customizable dashboard options by logging into the Google Merchant Center, clicking on “Performance” in the left sidebar menu, and selecting “Your reports.” From there, you have the ability to switch to the “Your Dashboards” tab at the top of the window.

Google Merchant Center custom dashboard creation

After you click “Create Dashboard,” you’re able to name it on the following screen. You can also link your existing reports, create new ones, or create scorecards with some basic performance metrics by clicking the blue plus sign.

Google Merchant Center custom dashboard adding new report

Your dashboard can display at least 80 reports or scorecards! We’ve noticed that the number changes based on the size of our computer monitor, so it may be much higher. In any case, this is a simple way to save your various reports and refer back to them at a glance.

These new reporting features won’t do a ton of heavy lifting when it comes to crafting a successful campaign strategy with Shopping Ads, but they’re certainly more informative than what was available previously in the Google Merchant Center. The dashboard is a great tool for keeping an eye on your Surfaces across Google clicks and Shopping Actions orders, and we’re looking forward to seeing how Google continues to improve its ecommerce capabilities in the Merchant Center.

Check out Google’s help pages to learn more about creating custom dashboards and custom reports.

Keep up with our blog for information about Google Merchant Center updates, including tips about free listings on Google Shopping and how to use custom labels to improve your ads.