Product Feedprint™ Benchmark
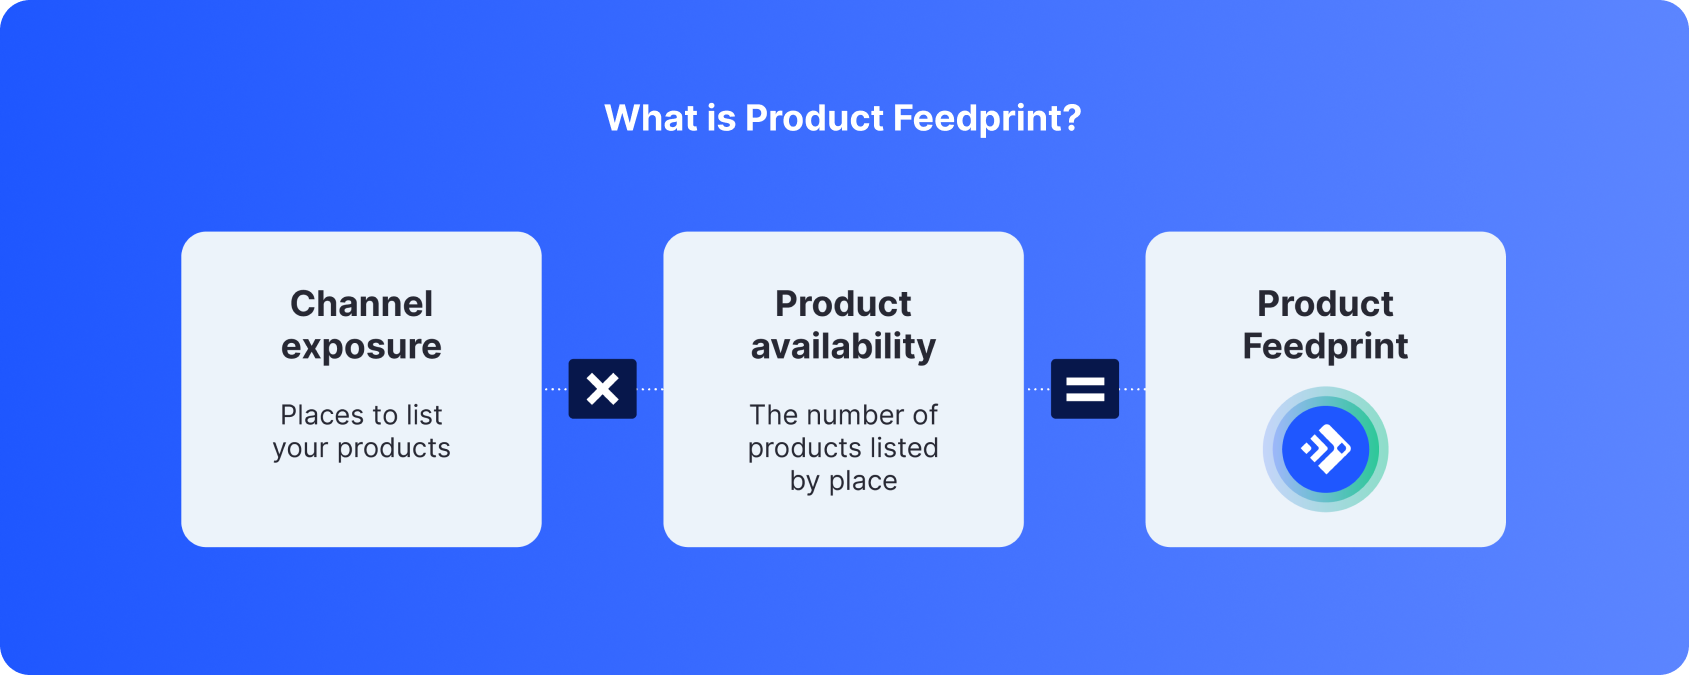
Channel exposure and product availability combine to establish a brand’s Feedprint™—a key indicator of ecommerce growth.

Introduction
Sourcing real growth extends beyond your own site, expanding your digital footprint to attract shoppers wherever they are.
To do so, you need to put your products to work, ensuring they represent your brand and fit each channel’s and shopper’s needs.
Together, the total number of products you send and optimize across shopping channels makes up your Feedprint™. Brands that expand their Feedprints are positioned for growth.
The Product Feedprint Benchmark is the authoritative report on product feed management, sharing the true story of channel exposure and product availability gathered through Feedonomics customer data.
+15.5%
Merchants expanded their
Feedprints 15.5%
79%
Optimizing product data for shopping
channels required product titles to
change 79%
+20.5%
Marketplace GMV grew 20.5%, more
than double the rate of
ecommerce growth
+17.9%
Merchants sold across 17.9% more
marketplaces
+9.6%
Same-marketplace-sales grew 9.6% year-over-year
67%
The top 20% of products generate
67% of all marketplace GMV

Feedprint expansion
Products are the atomic unit of Feedprint growth. Brands choose how deep and where to syndicate their products. Together, channel exposure and product availability combine to establish a brand’s Feedprint. Year-over-year, Feedprints have grown an impressive 15.5%.
Channeling growth
Channels are the vehicles that brands use to connect products to shoppers. And channel expansion is the leading Feedprint growth driver, rising 11.7% year-over-year and accounting for 77.4% of Feedprint growth.
Alongside channel growth, brands also increased the depth of their catalog offerings, as the number of products per channel rose 3.4%. The increase in both Feedprint factors—channel exposure and product availability—indicates a period of particularly strong growth.
Optimizing product data
Feedprint growth is not simply blasting your catalog across every shopping destination. Channels require your data to fit their specs.
When it comes to Google Shopping, for example, updates are most visible through the evolution of the quintessential product attribute: the title.
Product titles transform dramatically, nearly doubling in length from their original form. The average product title bulks up by 31 characters.
From short to long
Whether the original product title is short, average, or long, each needs to be made more precise for the channel and the shopper’s needs. The median product title changes by 79%.
The effort behind optimization
There is a natural trade-off that merchants typically face when syndicating their product catalog: expand to more places or improve quality of product data. The right tools and expertise help brands sidestep this trade-off, to enjoy both optimized product data and Feedprint expansion.
With less manual effort exerted optimizing feeds and resolving issues, it’s no surprise that Feedonomics customers can expand their Feedprints so aggressively.
A focus on marketplace growth
As ecommerce has matured, brands and retailers have turned to new selling channels, namely marketplaces, to source growth. And they are finding it.
Brands and retailers grew their marketplace-sourced revenue at more than two times the ecommerce growth rate*.
Growth is earned organically, via marketplaces where they already list products, and by expanding to new marketplaces.
*Source: US Census Q1 ‘24 ecommerce growth: +8.5%.
Where to grow?
While Amazon is the clear leader for brands to source marketplace growth, the other digital heavyweights—Target, eBay, and Walmart—have emerged as prominent growth channels.
TikTok Shop has quickly risen to establish itself as a new marketplace channel, accounting for 2.1% of marketplace revenue share.
The top product mandate
By definition, top products claim the most gross merchandise volume (GMV), but the weight is staggering. The top 20% of products generate 67% of all GMV.
With top products claiming so much GMV, the mandate for all brands is to get top product data right, and leave no top product behind.
The top is getting heavier
At a time when marketplace GMV is growing, the top products are taking slightly more GMV share. The top 20% of products increased their share by 1.9 percentage points.
Don’t be fooled by the seemingly small shift. The movement represents a meaningful 5.6% decline in contribution from the bottom 80% of products.
About the report
The Product Feedprint Benchmark is a set of aggregated and anonymized insights of product feed performance from across Feedonomics customers. Strict aggregation measures are employed to ensure anonymity. These measures include requirements on analysis set size, diversity, and consistency in order to present credible and reliable information that is insulated from concentration risk.
To qualify for inclusion in the year-over-year analysis, each customer must have been in production throughout the analysis period. The analysis periods were as follows:
- Feedprint values: January 2024 over January 2023.
- Product title analysis: exports to Google Shopping, April 2024
- Marketplace metrics: Six-month period measured year-over-year, November 2022 through April 2024
Data may not be exact due to rounding. Data footnotes are noted throughout the report to provide additional clarity on analysis. The Product Feedprint Benchmark is not directly indicative of the operational performance of Feedonomics or its reported financial metrics. The performance metrics shared within this report are calculated based on the analysis set, and should not be taken as a guarantee of feed management performance or results.
The Product Feedprint Benchmark report and insights were developed with Leading Lights.


